Listen to the article
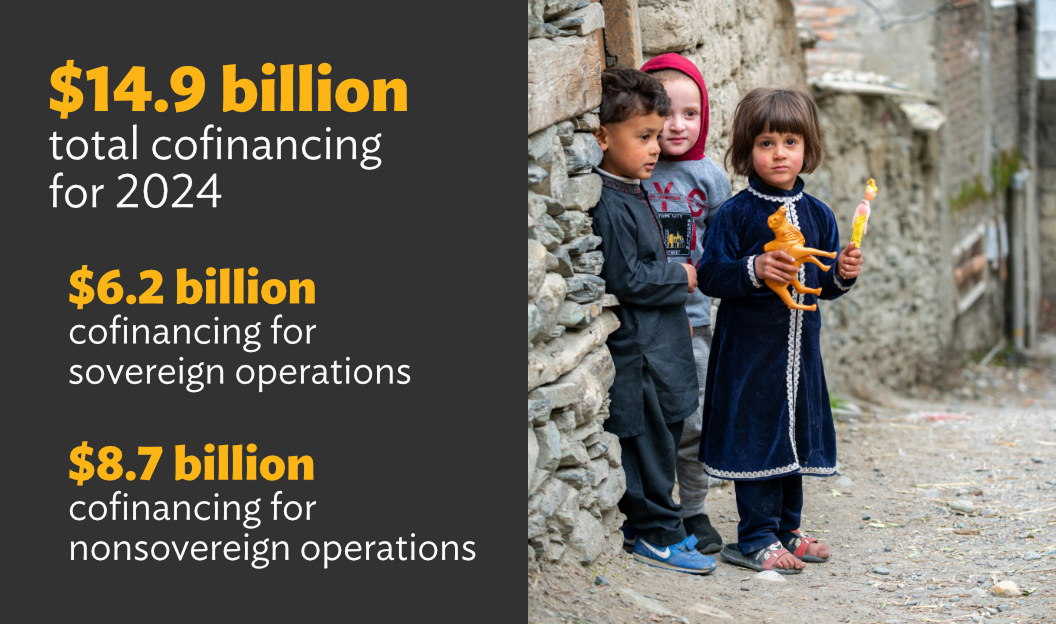
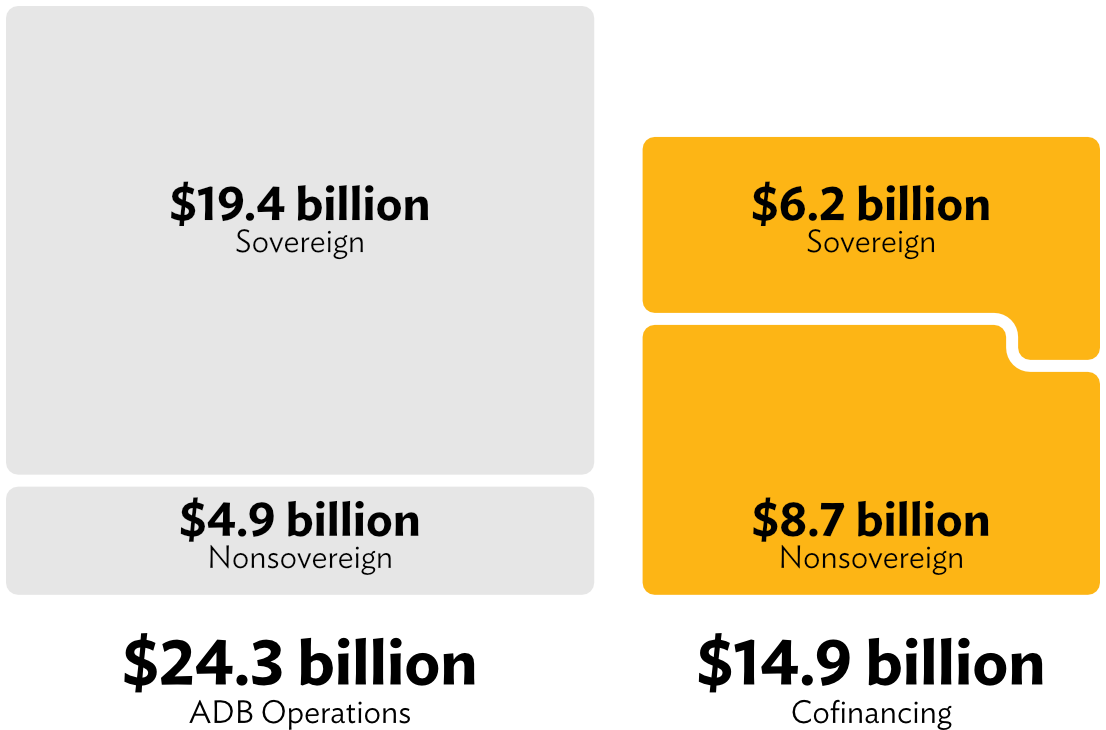
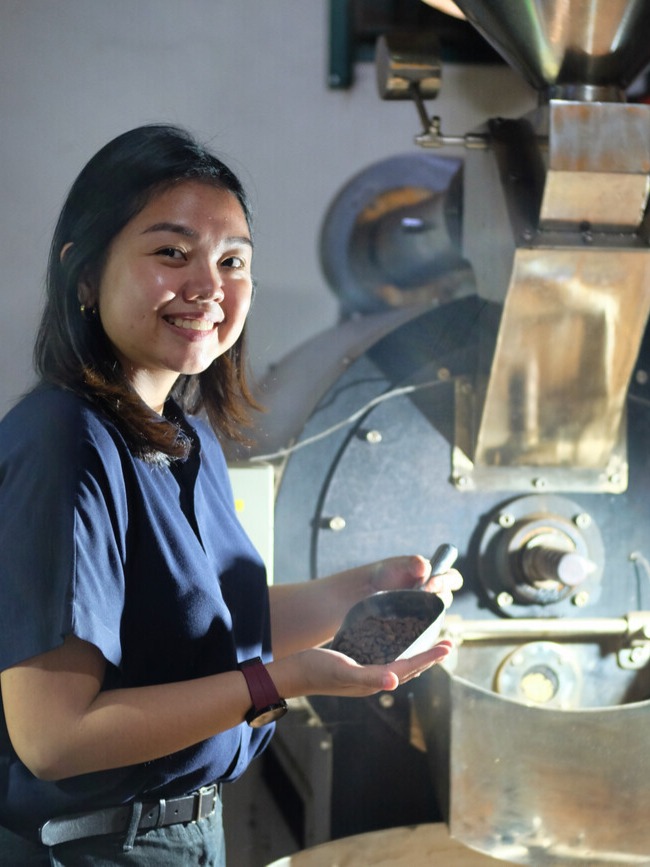
ADB continued to strengthen its partnerships in 2024, securing $14.9 billion in cofinancing from bilateral and multilateral partners, global funds, and trust funds to complement its investment of $24.3 billion. ADB’s support for its developing member countries focused on ensuring people’s well-being and empowerment, protecting the planet and its natural capital, and advancing prosperous economies built on sustainable and inclusive growth.
Strengthened partnerships and expanded cofinancing efforts enable ADB to maximize development impact across Asia and the Pacific.
Mobilizing for Impact
ADB committed $24.3 billion from its resources in 2024 to advance development across Asia and the Pacific. This funding supported 195 projects, 378 technical assistance initiatives, and over 27,600 transactions under private sector programs.
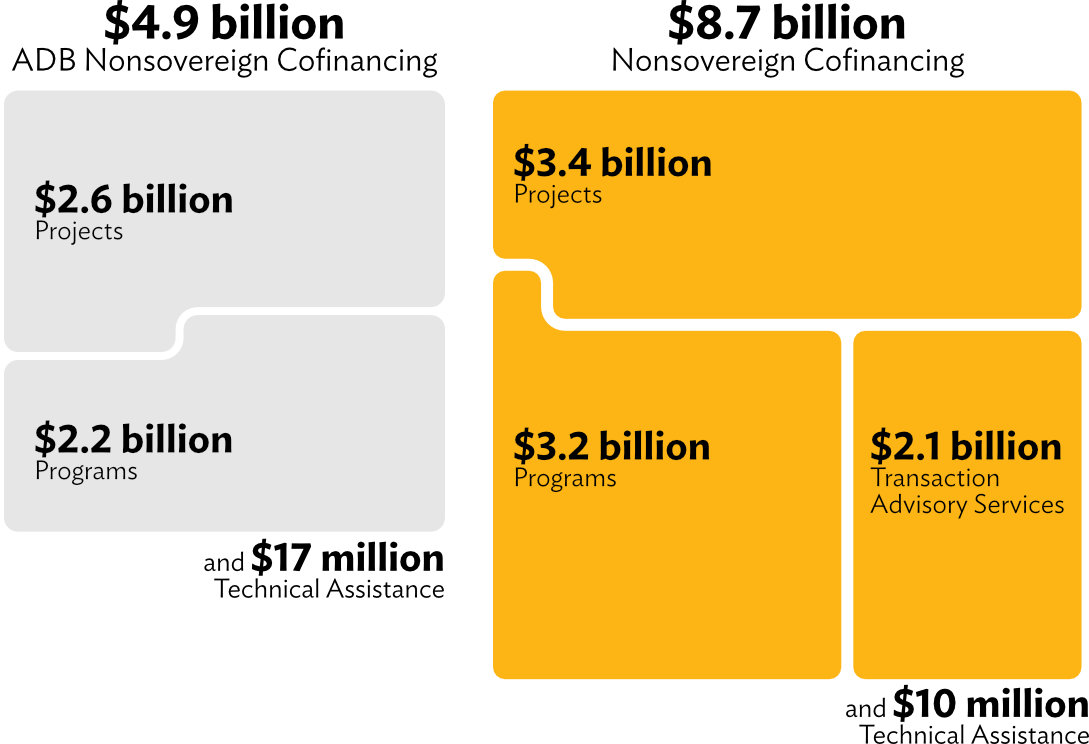
Of this, $19.5 billion was spent on sovereign operations, providing critical financial and technical support to governments of developing member countries. Meanwhile, $4.9 billion was directed toward nonsovereign operations, supporting private and state-sponsored companies.
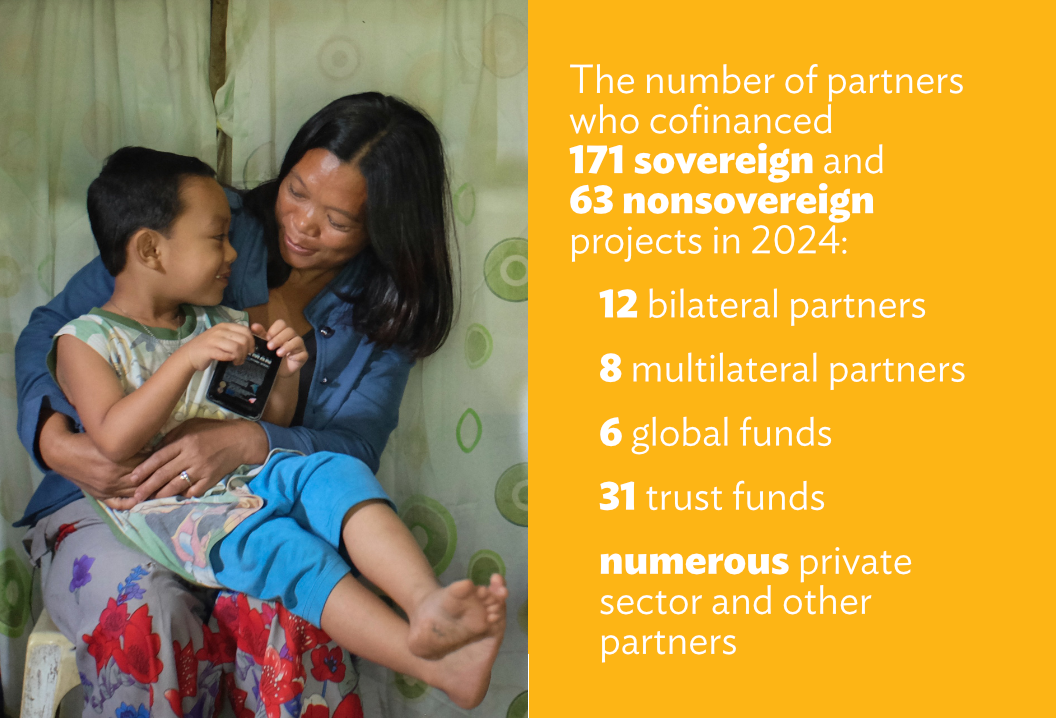
ADB’s financing partners played a crucial role, contributing an additional $14.9 billion in cofinancing. This included $6.2 billion for 171 sovereign projects and technical assistance (TA) projects, and $8.7 billion for 63 nonsovereign projects, TAs, trade and supply chain finance and microfinance programs, and transaction advisory services.
Expanding the Reach
Engaging diverse financing from bilateral and multilateral partners, global and trust funds, and private sector contributors helped ensure that the additional funding extended to over 40% of ADB projects in 2024.
Among ADB’s 49 regional members, 39 secured cofinancing support. India led in sovereign cofinanced projects, with funding for five projects, followed by Cambodia and Nepal with four each, and Armenia and Uzbekistan with three each. For nonsovereign operations, India again topped the list with 11 projects, followed by Bangladesh (6) and Mongolia (5).
Diverse Partners
ADB worked with a broad network of partners, collaborating with 12 bilateral agencies, 8 multilateral institutions, 6 global funds, and numerous private sector entities. Additionally, 31 of its 49 active trust funds supported new projects, with 22 backing sovereign operations and 10 funding nonsovereign initiatives. One trust fund—the United Kingdom–ASEAN Catalytic Green Finance Facility Trust Fund—cofinanced both sovereign and nonsovereign operations.
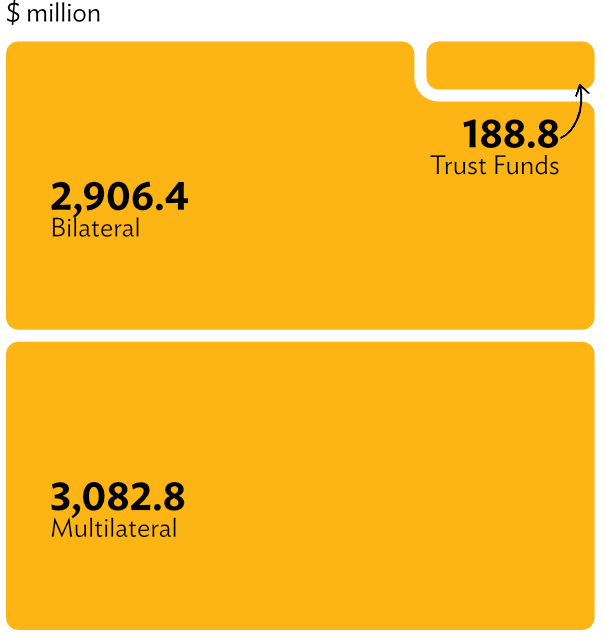
For sovereign operations, multilateral partners account for half of the cofinancing for 2024. Bilateral partners account for 47% and trust funds shouldered 3%.
- Multilateral partners committed $3.1 billion for 43 projects, with 85% of contributions coming from the Asian Infrastructure Investment Bank, European Investment Bank, European Bank for Reconstruction and Development, and the World Bank.
- Bilateral partners contributed $2.9 billion for 35 projects, with France, Germany, and the Republic of Korea (ROK) providing 94% of this funding. This marked the first year the ROK emerged as the top bilateral cofinancier.
- Global funds committed $314 million, a 283% increase from 2023’s $82 million, with major contributors including the Climate Investment Funds; Global Environment Facility; Global Partnership for Education Fund; Green Climate Fund; Pandemic Prevention, Preparedness, and Response Trust Fund; and the Women Entrepreneurs Finance Initiative.
- Trust funds played a key role in supporting projects, with 113 sovereign projects and 23 nonsovereign projects funded. Among the trust funds for sovereign operations, the Japan Fund for Prosperous and Resilient Asia and the Pacific financed 33 projects, the Republic of Korea e-Asia and Knowledge Partnership Fund supported 17 projects, and the High-Level Technology Fund contributed to 14 projects. For nonsovereign operations, the ADB Ventures Investment Fund 1 and Leading Asia’s Private Infrastructure Fund 2 provided funding for eight and seven projects.
Strengthening Partnerships
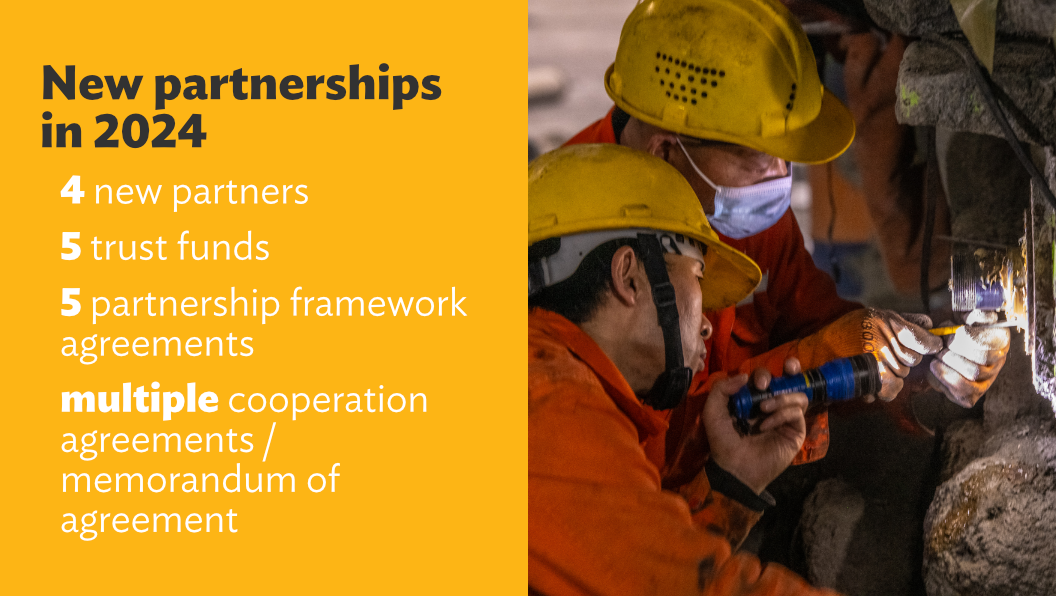
ADB expanded its network in 2024, forming strategic collaborations with two new entities:
- The Energy Foundation—To drive the clean energy transition, combat climate change, and promote sustainable prosperity in Asia and the Pacific.
- South Asian Association for Regional Cooperation Development Fund—To foster economic growth, social progress, and poverty alleviation in South Asia through project collaboration and technical assistance.
Two partners also made their initial direct investments in projects. The Pacific Community funded the Climate-Resilient Energy and Water Sector Project in the Federated States of Micronesia. Ireland, through the Department of Foreign Affairs, supported the Bridging the Gap Between Climate Adaptation Planning and Financing as part of the Advancing Climate Adaptation Action at Scale program.
Beyond new partnerships, ADB strengthened existing ties to mobilize additional resources. A new framework agreement with the Republic of Korea earmarks $2 billion in cofinancing with ADB for sovereign operations over the next 3 years. ADB also deepened its collaboration with the Asian Infrastructure Investment Bank, through a new agreement, targeting investments in cross-border connectivity, climate action, and private capital mobilization. The partnership with the new Climate Investment Funds Capital Market Mechanism allows ADB, alongside other multilateral development banks, to raise capital from international markets and mobilize private financing for developing countries. Meanwhile, a $100 million grant commitment from the Education Above All Foundation will expand educational opportunities in the region. ADB also formalized cooperation with UNICEF, reinforcing shared goals in sustainable economic growth and poverty reduction.
ADB also secured access to three major global funds to amplify development impact: Global Concessional Finance Facility, Clean Technology Fund Parallel Fund, and Global Biodiversity Framework Fund.
Additionally, ADB launched five new trust funds in 2024. Four are dedicated to climate and disaster resilience:
- ADB Ventures Investment Fund 2—a multi-contributor trust fund that invests in early-stage technology-driven companies to support sustainable development goals in emerging Asia and the Pacific
- Canadian Climate and Nature Fund for the Private Sector in Asia—ADB’s largest single-donor climate trust fund for the private sector, marking Canada’s third climate collaboration with ADB
- Central Asia Regional Economic Cooperation Climate (CAREC) and Sustainability Project Preparatory Fund—addressing financing gaps for climate and sustainability initiatives in CAREC countries
- Innovative Finance Facility for Climate in Asia and the Pacific Grant Trust Fund—accelerating climate investments through project preparation, capacity building, and knowledge-sharing.
The fifth new trust fund, the International Finance Facility for Education Trust Fund, supports transformational education programs.
Sovereign Cofinancing
What is sovereign cofinancing?
Sovereign cofinancing is third-party funding that contributes to ADB outcomes.
All ADB projects and technical assistance can be cofinanced, with details varying in terms of
- ADB’s administrative responsibility for the project (i.e., full administration, partial administration, or no administration);
- what terms apply (i.e., loans or grants);
- whether it is for a specific project (project-specific cofinancing) or theme (trust fund activities).
In 2024, sovereign cofinancing reached $6.2 billion, aligning with pre-pandemic levels (the 5-year average before 2020 was $6 billion). While the total volume of cofinancing declined from the previous year, the number of cofinanced projects increased by 38%, highlighting stronger collaboration across a broader range of initiatives.
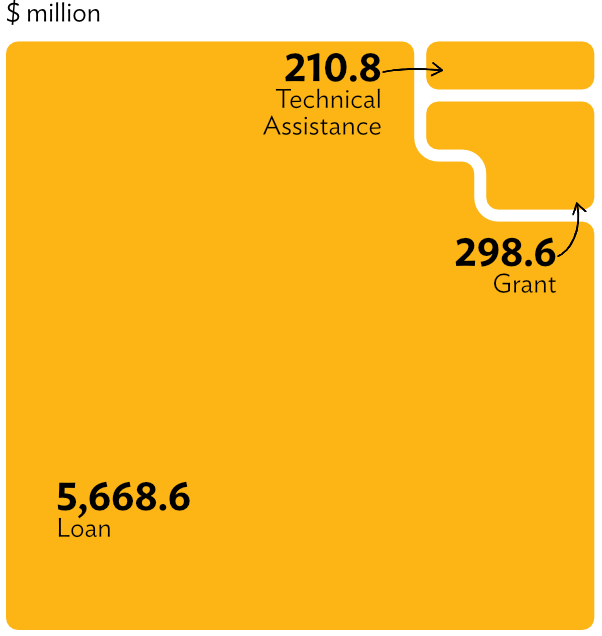
The partners supported 171 sovereign projects and technical assistance with cofinancing, distributed as follows:
- 25 projects received loan cofinancing totaling $5.7 billion, a decrease of 3 projects and 38% lower in volume compared to 2023;
- 30 projects received grant cofinancing worth $299 million, marking a 36% increase in funding and 5 additional projects;
- 120 technical assistance initiatives benefited from $211 million in grant cofinancing, showing 58% growth in project count and a 112% increase in funding compared to 2023.
The cofinancing-to-ADB financing ratio stood at 32%, meaning every $1 from ADB mobilized $0.3 in additional resources.
How Cofinancing Was Structured
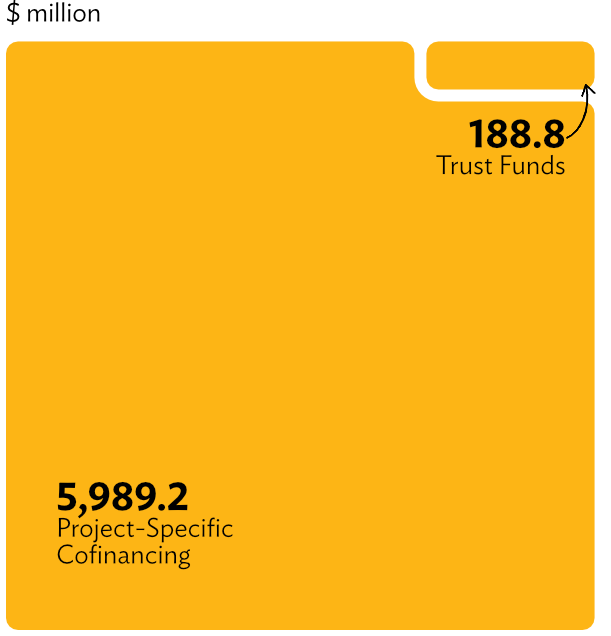
Nearly all cofinancing (97%) was directly invested in 69 projects. The remaining $189 million (3%) came from trust funds, supporting 113 projects and technical assistance initiatives.
See the sections on project-specific cofinancing and trust funds for details.
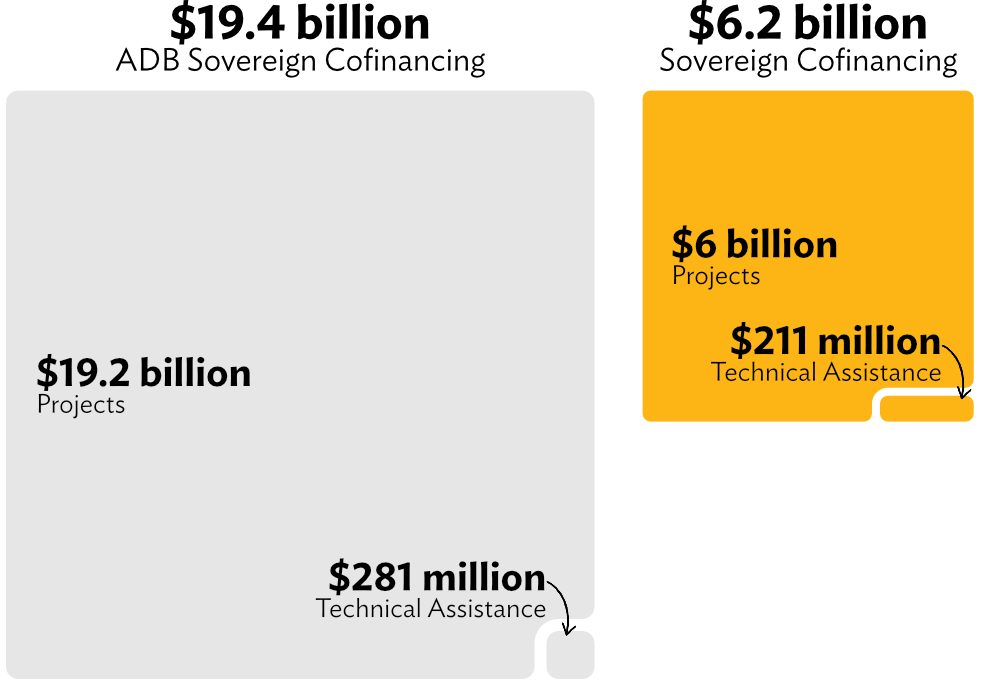
Of the $6.2 billion in sovereign cofinancing,
- 92% ($5.7 billion) were loans that ADB’s partners provided alongside ADB’s investment projects.
- The remaining $509 million was in grant funding—$299 million for projects and $211 million for technical assistance initiatives.
- Grant cofinancing surged by 60%, from $319 million in 2023 to $509 million in 2024.
- Australia contributed the most grant funding ($80.2 million), followed by Japan ($74.6 million).
The year 2024 can be characterized by an almost even distribution of commitments between bilateral and multilateral partners. Multilateral partners and global funds accounted for 47% of loan cofinancing while bilateral partners provided 45%. Grants for projects also had near parity, with bilateral partners committing $127 million while multilateral partners and global funds shared $130 million.
ADB’s sovereign cofinancing came from 12 bilateral partners, 8 multilateral institutions, 6 global funds, and 22 trust funds, supporting 171 projects and technical assistance initiatives.
As bilateral partners, and excluding their commitments via trust funds, the Republic of Korea, France, and Germany accounted for 94% of total bilateral cofinancing. Australia backed the most projects (12), followed by France (8) and New Zealand (7).
Among multilateral partners, the Asian Infrastructure Investment Bank (AIIB) and the World Bank, between them, committed 62% of the $3.1 billion in multilateral cofinancing. The Global Environment Facility supported 10 projects, the Climate Investment Funds backed 6 projects, while the AIIB and World Bank each supported 5 projects.
Where The Funding Went
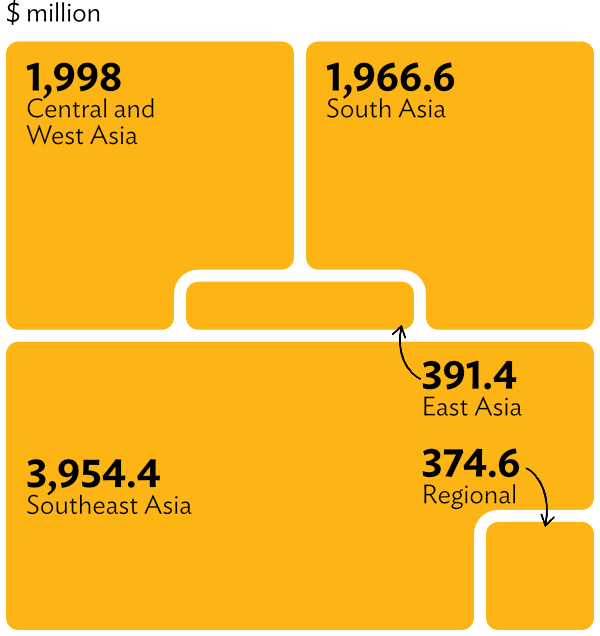
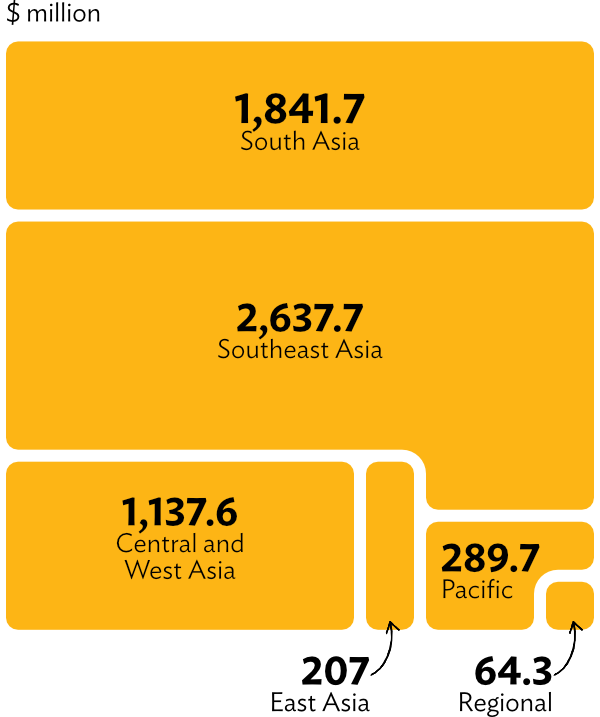
Southeast Asia received the largest share of cofinancing, totaling $2.6 billion (43% of the total), across 55 projects and technical assistance (TA) initiatives. Indonesia led the region with 26 cofinanced projects, followed by Cambodia (18) and the Philippines (16).
South Asia followed, securing $1.8 billion (30%) for 54 projects and TAs. Nepal had the highest number of cofinanced projects in the region at 21, trailed by India (19) and Bangladesh (13).
Central and West Asia accounted for $1.1 billion (18%), supporting 33 projects and TAs. Kazakhstan received the highest volume of funding, with $592 million across 5 projects, while Uzbekistan led in project count with 12 cofinanced initiatives, followed by Armenia (10).
The Pacific region had the highest number of cofinanced projects and TAs relative to other regions, with 31 initiatives. Samoa, Solomon Islands, Tonga, and Tuvalu each received support for two projects.
In East Asia, Mongolia secured cofinancing for eight projects and TAs, while the People’s Republic of China secured cofinancing for five.
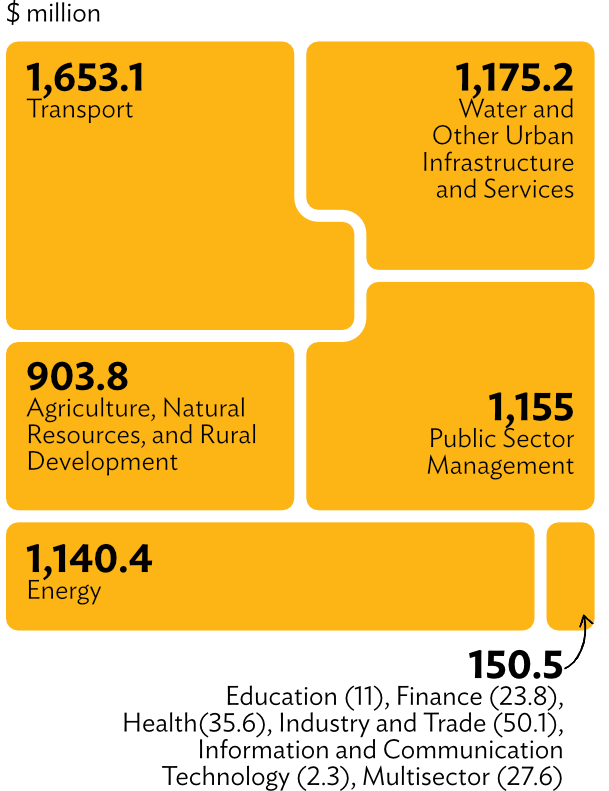
Five key sectors accounted for 98% of total cofinancing: agriculture and natural resources, energy, public sector management, transport, and water and other urban infrastructure.
Some of the biggest shifts in funding included:
- Water and urban infrastructure projects grew 442% in commitments and 86% in project count (26 projects total).
- The health and public sector management sectors saw the biggest declines, with funding down 98% and 58%.
- Energy projects led in number (32 projects), followed by public sector management (31 projects).
- Multisector projects surged by 821% in volume and rose to five projects from one in 2023.
Nonsovereign Cofinancing
What is nonsovereign cofinancing?
Nonsovereign cofinancing can be from both private and public institutions. The funds are usually sourced from financial markets and priced at commercial terms. It can be categorized by
- tenor or duration of the engagement, e.g., short-term (less than 1 year) and long-term products;
- product (e.g., B loans, guarantees, parallel loans and bonds, risk transfers, transaction advisory services, and programs).
Nonsovereign cofinancing in 2024 reached $8.7 billion, a 26% increase from $6.9 billion in 2023. Of this, $3.4 billion was allocated to projects, reflecting a modest 3% growth from 2023 numbers.
Cofinancing under the Trade and Supply Chain Finance Program grew by 2%, but the more significant change was in transaction volume, which surged to 27,600 from 21,400 the previous year. The program supported approximately 13,500 small and medium-sized enterprises across the region, with more than 20% of transactions directed toward food and agricultural commodities.
Commitments for transaction advisory services rose by 369%, primarily due to the $2.1 billion Ninoy Aquino International Airport Project in the Philippines. As with 2023, transaction advisory services mobilized private sector investments through public–private partnerships for two projects, the second one being the Public–Private Partnership Demonstration Program for Elderly Care Services in Yichang, Hubei, People’s Republic of China ($5 million).
The long-term nonsovereign cofinancing ratio1 for 2024 was recorded at 2.6, meaning every $1 of ADB investment generated $2.6 in cofinancing.
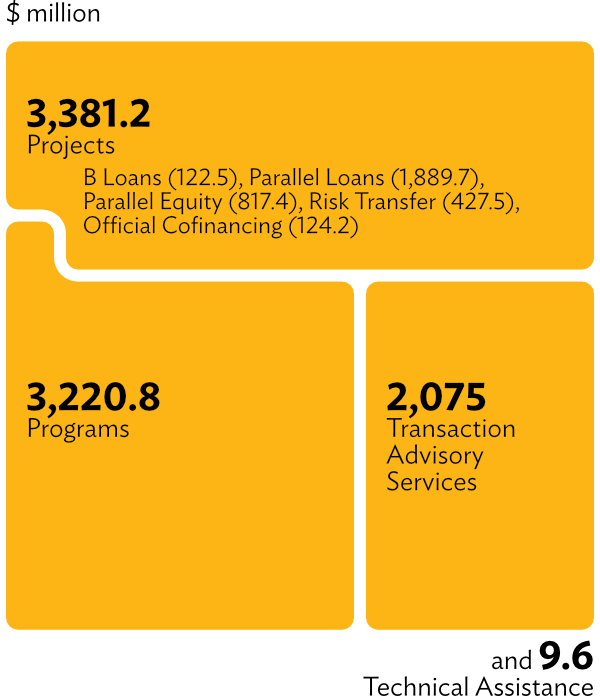
In total, 63 projects, programs, technical assistance (TA) initiatives, and transaction advisory services benefited from these resources, broken down as follows:
- 53 projects received $3.4 billion in cofinancing
- 5 TA initiatives secured $10 million
- 2 transaction advisory services reached $2.1 billion in cofinancing
- 3 programs, the Trade and Supply Chain Finance Program and the Microfinance Program, accounted for $3.2 billion, supporting 27,600 transactions
How Cofinancing Was Structured
Most project cofinancing came from parallel loans, which accounted for $1.9 billion, or 56% of total project cofinancing. Parallel equity and risk transfers followed, contributing $817.4 million and $427.5 million. More details can be found in the nonsovereign operations section.
In addition, partners supported nonsovereign operations through cofinancing from nine trust funds.
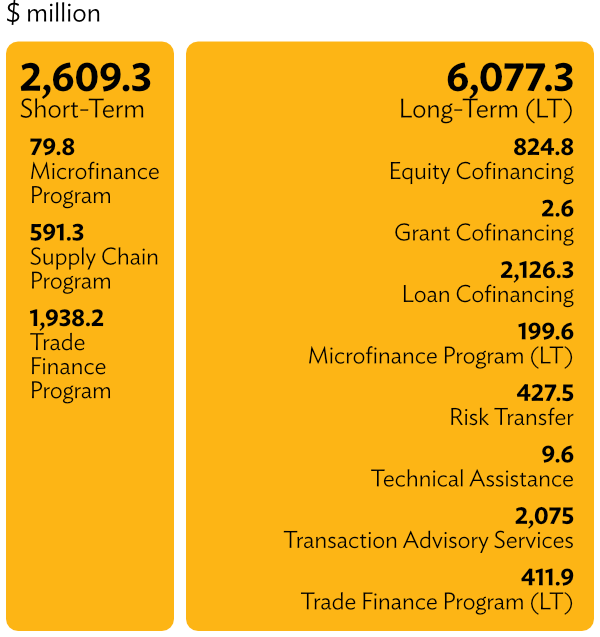
Short-term cofinancing, which typically lasts less than a year, mainly covers transactions under the Trade and Supply Chain Finance Program and the Microfinance Program. It accounted for 30% of the $8.7 billion cofinancing for private sector operations (less transaction advisory services).
At $6.1 billion, long-term cofinancing—which includes grant, equity, loan, and technical assistance cofinancing; risk transfers; and some longer-term transactions under the private sector programs—rose by 65% from 2023’s $3.7 billion commitments.
Where The Funding Went
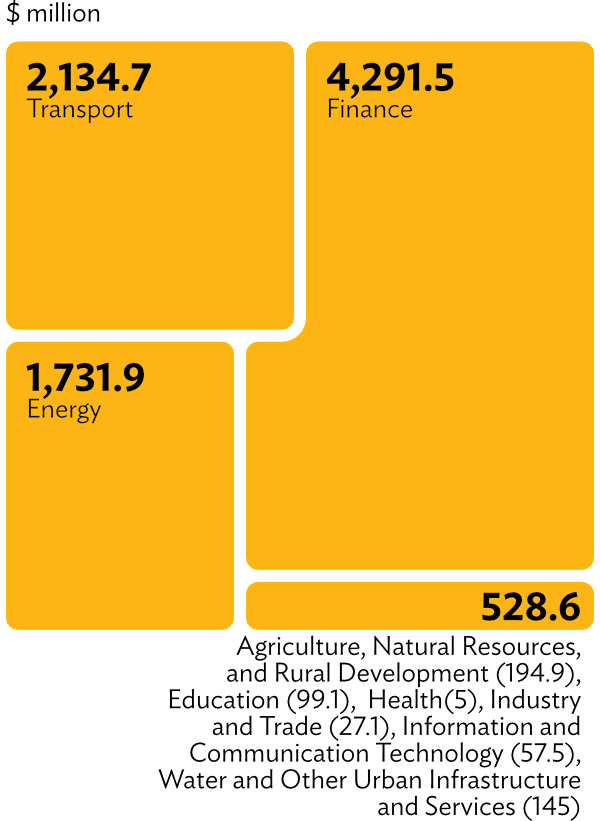
As with the previous year, the finance sector received the bulk of nonsovereign cofinancing at 49%, totaling $4.3 billion and covering 91 nonsovereign operations. The transport sector followed with $2.1 billion.
By volume of cofinancing, countries in Southeast Asia received $4 billion in commitments or 46% of nonsovereign cofinancing. Central and West Asia and South Asia followed with $2 billion each, or 23% of sovereign cofinancing.
By the number of cofinanced projects, Southeast Asia topped the list with 35 projects.